
Logs Don't Lie: Predicting Threats with Entra ID User Behavior

Understanding how people use their accounts can significantly help prevent and detect cyber threats, even in their early stages. While successfully stopping cyber threats involves many systems and ongoing organisation training, watching how users normally act lets us spot anything out of the ordinary.
🤯 “Fun” fact, the Microsoft Digital Defense Report 2024 it highlights ~99% of attacks on Entra ID, around 600 million per DAY (yes, you ready that correct) are password attacks (password spray, phishing etc)
Those unusual actions might be early signs of someone breaking in or an insider causing trouble. What’s surprisingly helpful is that are the log files. These records of what happened, often ignored, actually hold a lot of information. When we look at them closely, they help us build smart systems that can find weird patterns and show us clear pictures of what’s going on, so we can stop problems before they get big.
Let’s take a look at how we can leverage these logs out of the Veeam Backup for Entra ID that already protects your users, groups, app registrations and more. Enabling a practical, cost effective way to turn raw Entra ID logs into useful security information to form part of your defenses.
How the Anomaly Detection System Works
The system follows a four-step process to get from raw log data to finding potential security issues.
1. Getting and Preparing the Data
First, we need to collect the data in a usable way. This means taking sign-in and audit logs from Veeam Backup for Entra ID, whether it’s a system you manage yourself or Veeam Data Cloud. These logs from from Microsoft in a multi-layered format. The engine flattens this data, making it much simpler to work with, and then saves it in a database. MongoDB was my choice here for it’s flexibility.
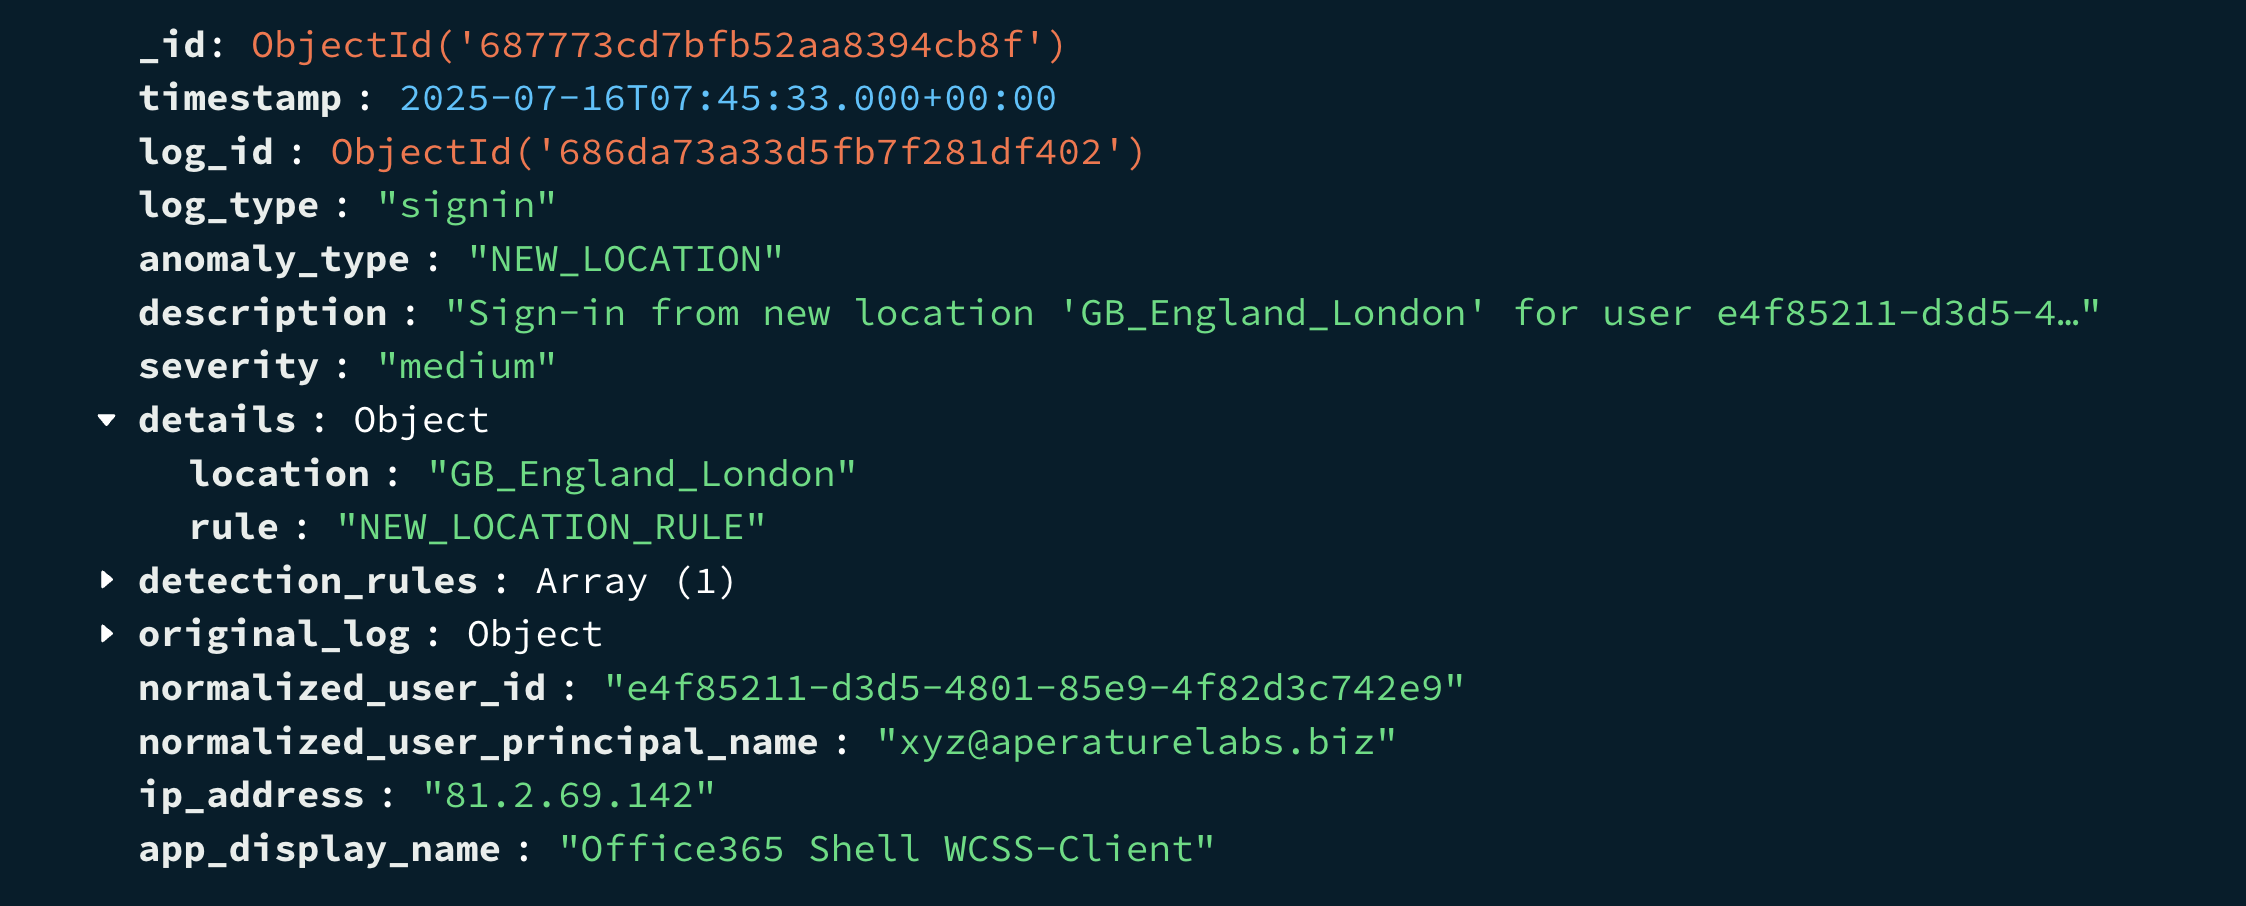
Take a look below at the sign-in event before and after flattening.
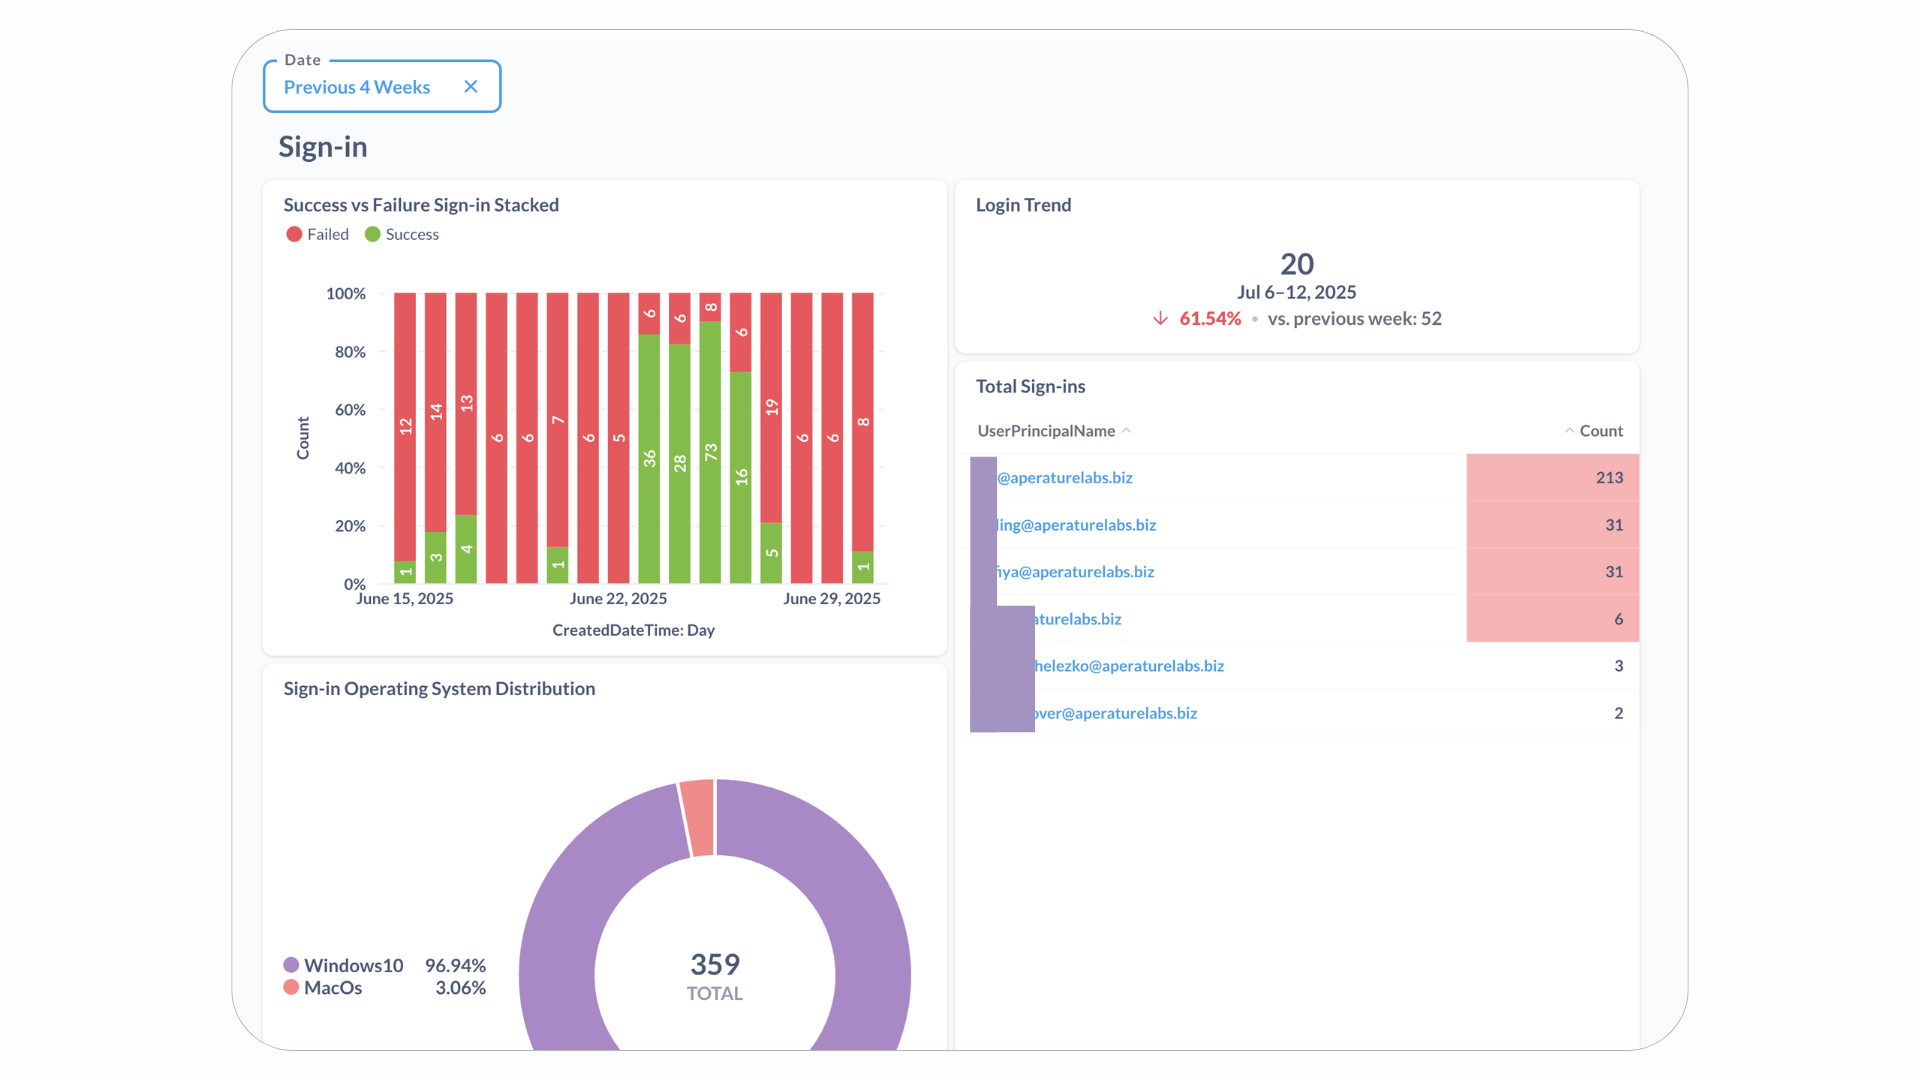
Even this first step is valuable on its own. Just collecting and organising the logs lets us see basic trends and overall activity. This gives you a fundamental view of what’s happening in your Entra ID without needing any fancy AI or machine learning yet. Instant value unlock from backup data!
Here is a simple dashboard just using a small portion of the information to give you insight into these log files.
2. Understanding User Behaviour, Training and Baseline Building
This is where the clever part, using machine learning, comes in. Before we can find something abnormal, the system needs to learn what “normal” looks like for each user. This involves two main parts: statistical baselines and machine learning models.
The system looks at past log data (for example, from the last 60 days) to create a unique “behavior profile” for every user. Think of a baseline as a regular user’s typical activities. It records things like:
-
Where they usually log in from (IP addresses and locations).
-
When they usually log in (time of day and day of the week).
-
Which programs and devices/operating systems they normally use.
-
How often they typically have failed login attempts and how often they login.
On top of these basic rules, the system uses a machine learning algorithm called Isolation Forest for each person.
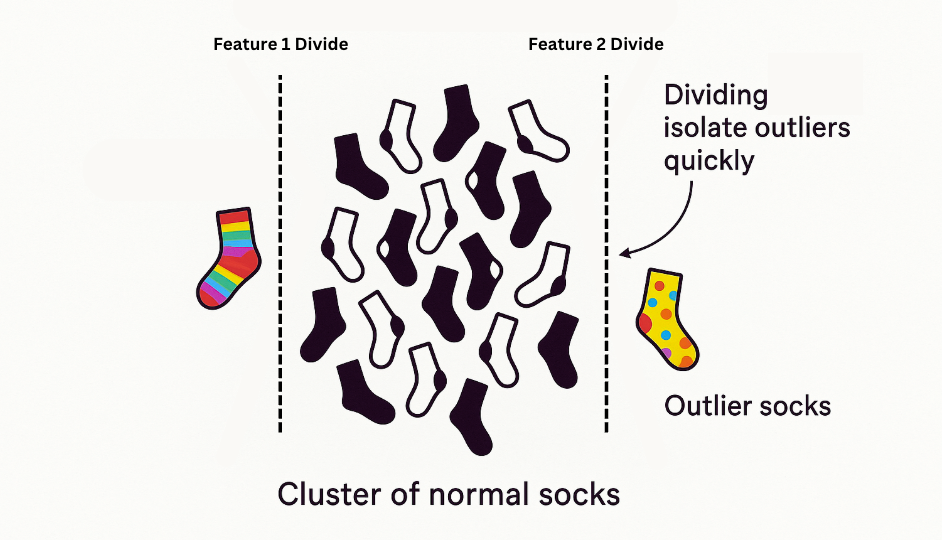
What is Isolation Forest?
Imagine you have a big pile of socks. Most are common colors like black or white, but there are a few really unique, brightly patterned ones. The Isolation Forest doesn’t try to identify every single sock. Instead, it focuses on finding the “odd ones out.” It does this by randomly picking a feature (like color or pattern) and then a random value to divide the socks. The unusual socks are usually easier to separate because there are fewer of them and they look different from the typical ones. The model essentially makes many simple “decisions” to isolate these unusual data points with fewer steps. If a login event gets separated very quickly, it’s considered out of the ordinary. The great thing is this technique is very efficient making it perfect for processing thousands of sign-in log entries.
Training a separate model for each user can be very helpful. What’s normal for one person (like an IT admin who logs in from different places and devices) might be very strange for another (like a regular employee who always logs in from the same office computer). When you have enough data per user, this approach learns these individual differences, making its ability to spot odd behavior very precise. However, Isolation Forest can also work well on mixed datasets when per-user training isn’t practical.
To help the Isolation Forest understand the log data, information that’s in words (like program names or operating systems) is turned into numbers. This process is called feature engineering and uses something like a OneHotEncoder. It simply changes category names into a number format that the computer program can understand. This is different from the vector embeddings we’ve discussed in RAG systems - OneHotEncoder creates simple numerical labels rather than dense meaning-based representations.
All these calculated baselines and the trained Isolation Forest models are then stored in MongoDB, ready for the detection system to use later.
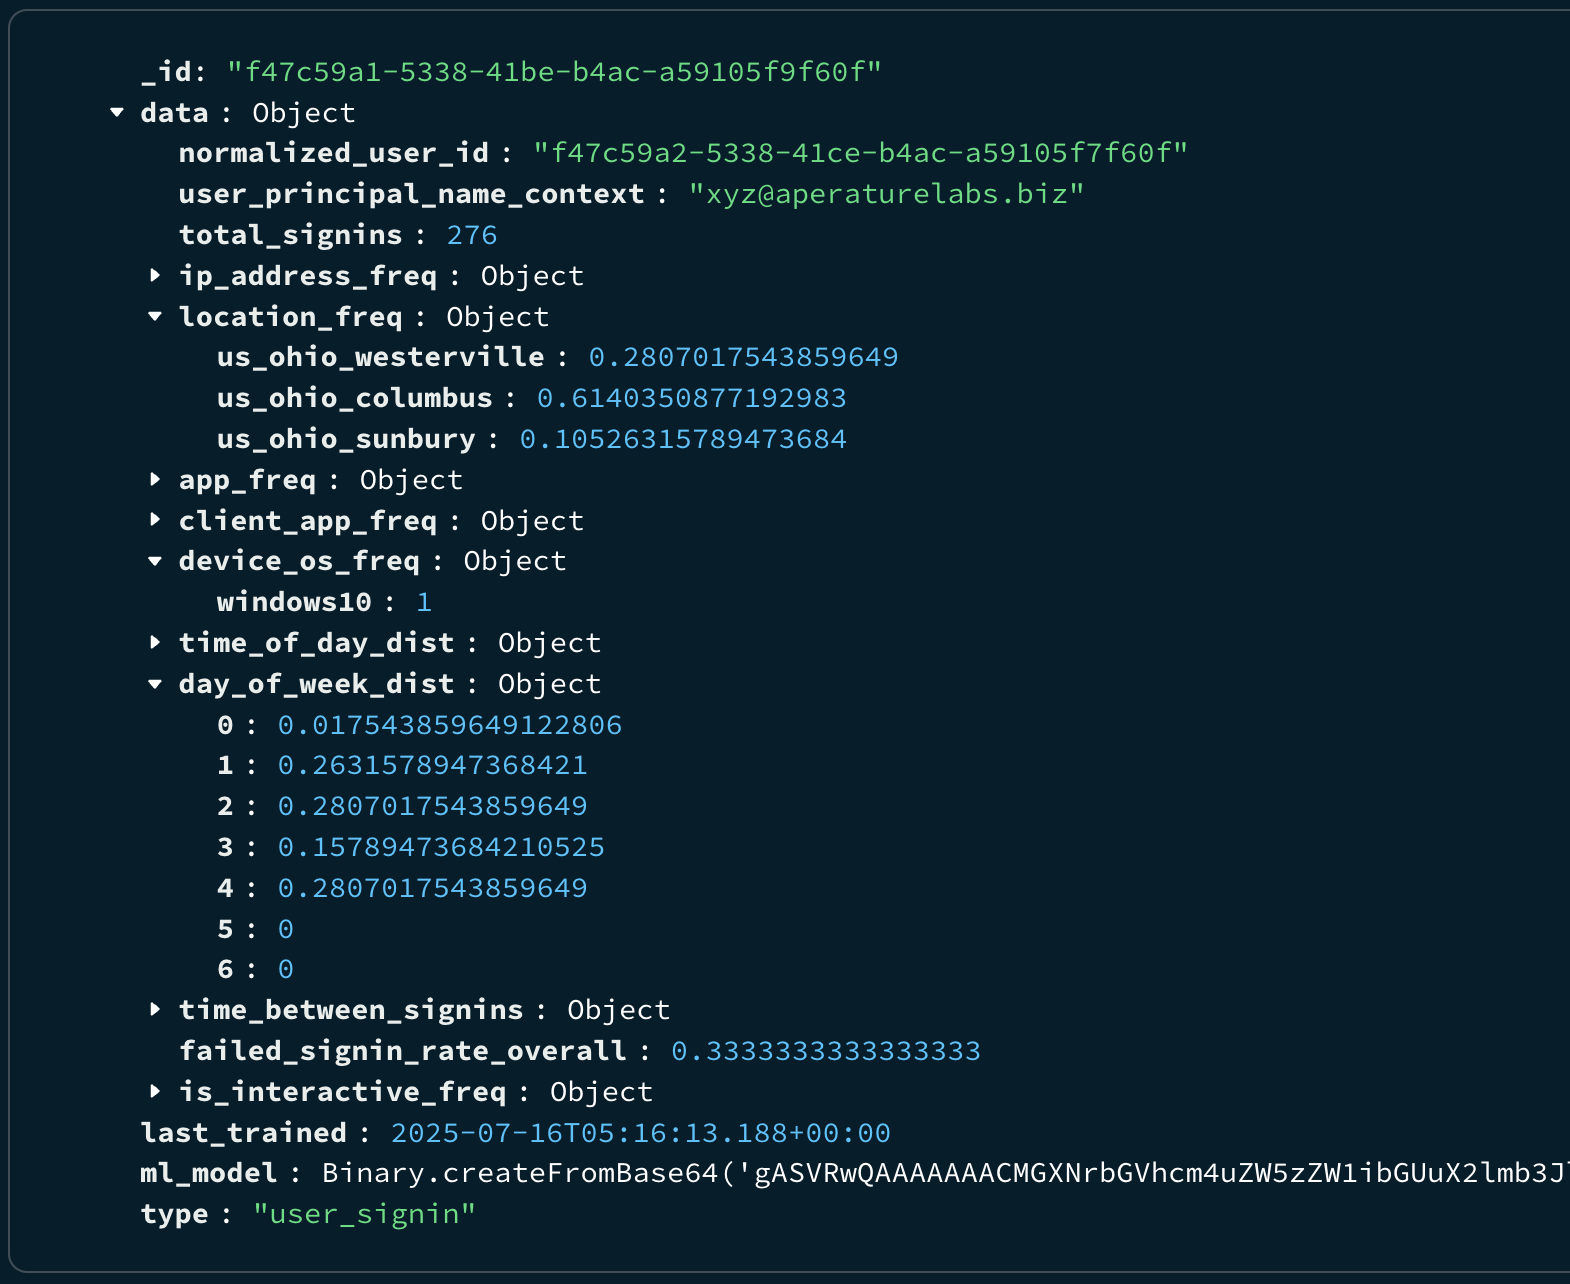
You can see from the above baseline examples some of the features we are capturing things like location, day of week distribution and many more.
3. Finding What’s Different, Anomaly Detection Engine at Work
Once we have the baselines and models, the Detection Engine constantly watches for new sign-in logs as they come into the database, these trickle in via an automated task that detects new backups, gets recent log files that have been added and then processed through the same flattening and ingestion step above. Each new login event is then checked against that specific user’s established normal behavior and their trained model.
The system looks for various types of unusual activities, such as:
-
New or Unusual IP Address/Location: Finding logins from an IP address or place that user has never logged in from before, or from one they use very rarely.
-
Unusual Program or Device Operating System: Noticing logins from programs or device types that the user doesn’t typically use.
-
Unusual Time of Day or Day of Week: Spotting logins outside of a user’s normal login days and hours outside of their baseline.
The system also looks at a couple of other behavioural metrics
-
Too Many Failed Sign-ins: Alerting if there are an unusual number of failed login attempts outside of normal baseline failure rate, which could mean someone is trying to guess passwords.
-
Impossible Travel: Catching logins close together that are from places that are too far apart to reach in the time between two logins say New Zealand and the UK in 6 hours.
When something unusual is found, it’s recorded in an “anomalies” collection in our database. Each record includes details about why it was flagged, how serious it is (low, medium, high, critical as determined by our own rules), and other information from the original log. You can then be alerted on these, or visualise them on a dashboard.
4. Making Sense of the Information: Reports and Visuals
The results from these steps are designed to be easy to see and understand, giving clear insights into user activity and potential problems.
Basic Activity Monitoring (from Step 1): The raw, organised log data itself can be used to show general trends and what people are doing. This helps you understand normal operations and can point out big changes in how users behave, even without the fancy anomaly detection.
Proactive Threat Analysis (from Steps 2 & 3): By looking at the detected anomalies, security teams can quickly find and investigate strange activities that don’t match normal patterns. This is a powerful tool for catching threats early and responding faster.
The below anomalies have been detected, I generated an anomalous log entry based off a baseline profile and then ran this through the engine. You can see it has picked up a number of anaomalies.
Below that is also the baseline training state showing visually when the model was last trained for each use and on how much data.
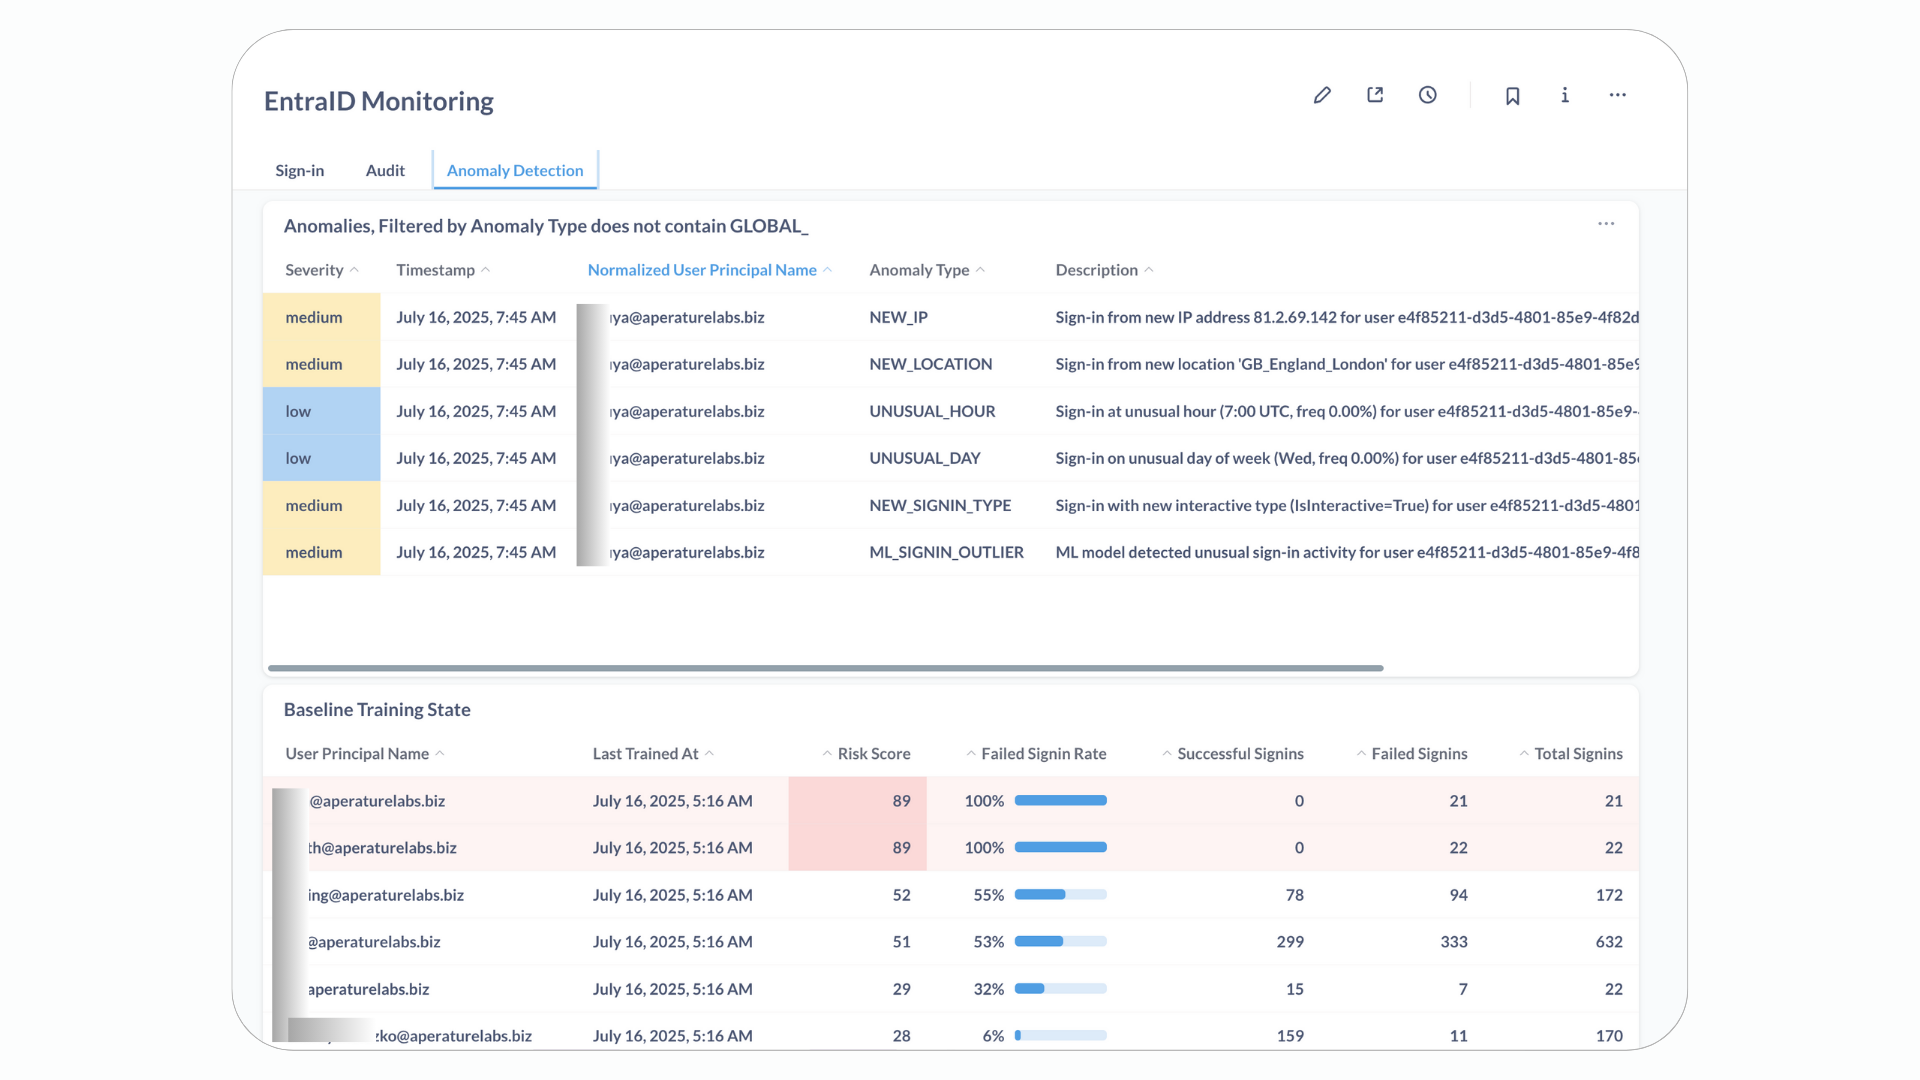
This project currently uses Metabase to show the data, which demonstrates how easily this processed information can be used with other reporting tools. Because the data is structured flexibly, it can also be used with other reporting platforms or used to build custom reports to meet your specific needs and even automatically alert on new detections.
Wrapping Up
We processed logs allowing for us to set up clear ideas of what normal user behavior looks like, and using smart machine learning techniques like Isolation Forest, it helps organisations move from just reacting to security problems to being much more proactive and smart about finding threats.
On top of all that being able show the results in clear, easy-to-understand visuals really helps monitor online identities.
All of this value created by leveraging something you already have. Logs inside your Veeam Backup for Entra ID. I call that a win-win scenario.