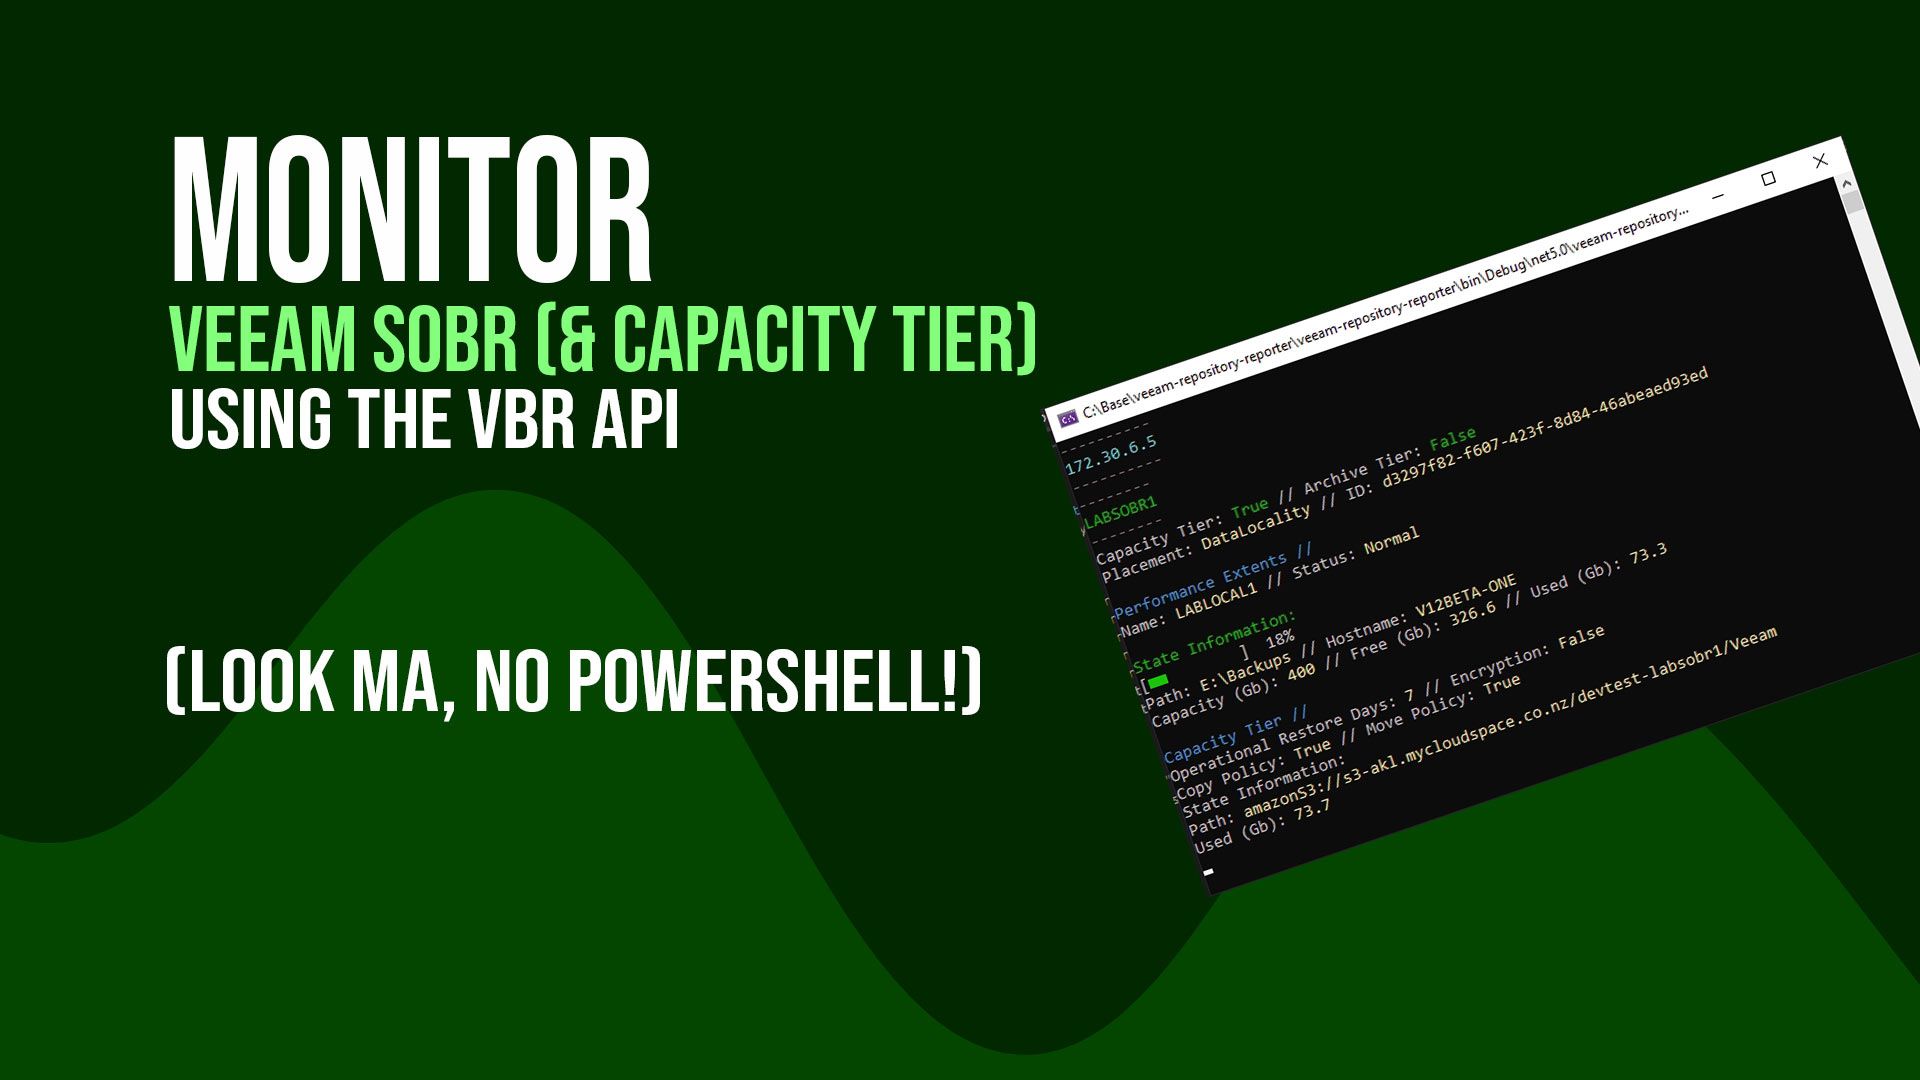
Monitor backup repository utilisation with the Veeam API
Monitoring your backup infrastructure is just as critical as monitoring your production compute and storage platforms. I set out to see using the new VBR API I could achieve this using these interfaces completely and not rely on other things like the PowerShell modules.
This request actually came through via John Quinn on Twitter after I asked if anyone was keen on seeing something specific.
Can you show Sobr data; storage used in perf tier & capacity tier & show used on faster disk & immutable storage? Also all settings in a job, retention, app awareness, basically full job schedule — John Quinn (@QuinnJohnD) September 29, 2022
So here you go John, this answers the first part (we will get onto your other queries in another post)
TLDR;
It is completely possible with just two api requests to show configuration about a SOBR as well as its “state” aka utilisation and health.
Source code to the sample app is at the end of the post.
What endpoints do we need?
What do we need to hit? Well as mentioned we can achieve this pretty easily using the two endpoints; (other than logging in of course to get a Bearer token)
/api/v1/backupInfrastructure/scaleOutRepositories
So this endpoint is going to return to us all of the Scaleout Backup Repositories attached to the backup server. The nice thing is it is a really rich source of information about each of them.
Below is a sample payload you will get back - let me cover some of the bits of required information + other useful bits I have used in the demo. We can just read all these into an array and then loop through them.
{
"data": [
{
    "id": "d3297f82-f607-423f-8d84-46abeaed93ed",
    "name": "LABSOBR1",
    "description": "Created by V12BETA-ONE\\benyoung at 30/09/2022 3:52 pm.",
    "tag": "D3297F82F607423F8D8446ABEAED93ED",
    "performanceTier": {
        "performanceExtents": [
            {
                "status": "Normal",
                "id": "cb5145ae-ee38-4d15-b8e5-6abac4616997",
                "name": "LABLOCAL1"
            }
        ],
        "advancedSettings": {
            "perVmBackup": true,
            "fullWhenExtentOffline": false
        }
    },
    "placementPolicy": {
        "type": "DataLocality",
        "settings": [
            {
                "allowedBackups": "All",
                "extentName": null
            }
        ]
    },
    "capacityTier": {
        "enabled": true,
        "extentId": "1f381f7e-470b-47b6-8292-63d4693ead8d",
        "offloadWindow": {
            "days": [
                {
                    "day": "sunday",
                    "hours": "1,1,1,1,1,1,1,1,1,1,1,1,1,1,1,1,1,1,1,1,1,1,1,1"
                },
                {
                    "day": "monday",
                    "hours": "1,1,1,1,1,1,1,1,1,1,1,1,1,1,1,1,1,1,1,1,1,1,1,1"
                },
                {
                    "day": "tuesday",
                    "hours": "1,1,1,1,1,1,1,1,1,1,1,1,1,1,1,1,1,1,1,1,1,1,1,1"
                },
                {
                    "day": "wednesday",
                    "hours": "1,1,1,1,1,1,1,1,1,1,1,1,1,1,1,1,1,1,1,1,1,1,1,1"
                },
                {
                    "day": "thursday",
                    "hours": "1,1,1,1,1,1,1,1,1,1,1,1,1,1,1,1,1,1,1,1,1,1,1,1"
                },
                {
                    "day": "friday",
                    "hours": "1,1,1,1,1,1,1,1,1,1,1,1,1,1,1,1,1,1,1,1,1,1,1,1"
                },
                {
                    "day": "saturday",
                    "hours": "1,1,1,1,1,1,1,1,1,1,1,1,1,1,1,1,1,1,1,1,1,1,1,1"
                }
            ]
        },
        "copyPolicyEnabled": true,
        "movePolicyEnabled": true,
        "operationalRestorePeriodDays": 7,
        "overridePolicy": {
            "isEnabled": false,
            "overrideSpaceThresholdPercents": 90
        },
        "encryption": {
            "isEnabled": false,
            "encryptionPasswordIdOrNull": "00000000-0000-0000-0000-000000000000",
            "encryptionPasswordTag": null
        }
    },
    "archiveTier": {
        "isEnabled": false,
        "extentId": null,
        "archivePeriodDays": 90,
        "advancedSettings": {
            "costOptimizedArchiveEnabled": false,
            "archiveDeduplicationEnabled": true
        }
    }
}
],
"pagination": {
"total": 1,
"count": 1,
"skip": 0,
"limit": 200
}
}
performanceTier/performanceExtents[] This is an array of performance extents, my lab only has a single (local) extent but in reality there will be more than one here. Therefore it is important to loop through each of these.
For each of these extents we want the **id **propertythis references which “state” we need to look at to get the usage information
capacityTier As it sounds, this has information about the capacity tier IF it is enabled. I have my SOBR tiering out to a s3-compatible platform. We can see all of the settings such as the copy policy and move immediately settings as well as encryption detail etc all of this is useful if you wanted to monitor for mis-configuration as en example)
From this section we are interested in the **extentId **property - this references which “state” we need to look at to get the usage information
archiveTier As it sounds, this has information about the archive tier IF it is enabled. I do not have this set in my lab but you can check policy here like the costOptimized and deduplication settings, neat.
/api/v1/backupInfrastructure/repositories/states
The Scaleout endpoint defined above returns us the configuration but you will note there is no reference to pathing, capacity etc - this is there this endpoint comes in. Conveniently we can fetch all of this at the same time and then just match it using the identifiers from the other endpoint
With the example payload below you can see this returns repository state information about all repositories such as S3Compatible (our capacity tier) and WinLocal (our performance extent)
{
"data": [
    {
        "type": "S3Compatible",
        "id": "1f381f7e-470b-47b6-8292-63d4693ead8d",
        "name": "benyoung-devtestlabsobr1",
        "description": "Created by V12BETA-ONE\\benyoung at 30/09/2022 3:52 pm.",
        "hostId": null,
        "hostName": null,
        "path": "amazonS3://s3-akl.mycloudspace.co.nz/devtest-labsobr1/Veeam",
        "capacityGB": 0.0,
        "freeGB": 0.0,
        "usedSpaceGB": 70.1
    },
    {
        "type": "WinLocal",
        "id": "88788f9e-d8f5-4eb4-bc4f-9b3f5403bcec",
        "name": "Default Backup Repository",
        "description": "Created by Veeam Backup",
        "hostId": "6745a759-2205-4cd2-b172-8ec8f7e60ef8",
        "hostName": "V12BETA-ONE",
        "path": "E:\\Backup",
        "capacityGB": 400.0,
        "freeGB": 330.2,
        "usedSpaceGB": 0.0
    },
    {
        "type": "WinLocal",
        "id": "cb5145ae-ee38-4d15-b8e5-6abac4616997",
        "name": "LABLOCAL1",
        "description": "Created by V12BETA-ONE\\benyoung at 30/09/2022 2:55 pm.",
        "hostId": "6745a759-2205-4cd2-b172-8ec8f7e60ef8",
        "hostName": "V12BETA-ONE",
        "path": "E:\\Backups",
        "capacityGB": 400.0,
        "freeGB": 330.2,
        "usedSpaceGB": 69.7
    }
],
"pagination": {
    "total": 3,
    "count": 3,
    "skip": 0,
    "limit": 200
}
}
So how do we match up our SOBR information with the relevant state? really simply.
We need to look at the **id **property, this is referenced in the SOBR model
- For the performance extents, we use the **id **property to map through to the **id **property on the state model
- For the capacity tier, we use the **extentId **property to map through to the **id **property on the state model
The Application
I have put together a dotnet core console application that can be cloned and run on any machine running the dotnet core v5 runtime for windows, macos or linux.
The application has example code of logging in to the VBR api and hitting the endpoints. It then prints the data to the screen looping through the performance extents showing the utilisation and some key information - same again for the capacity tier except this just has total storage consumed since Veeam won’t know the total capacity of the destination object store.
Adapt this as you need (i.e you may want to schedule this, post it to teams via Webhook, log a support ticket etc) or just use it as a base to modify into a programming language of your choice.
Settings
via appsettings.json is where you can configure it for your use
{
    "VBR": {
    "Host": "yourvbrserver.local",
    "Port": 9419,
    "APIVersion": "1.0-rev1",
    "APIRouteVersion": "v1",
    "Username": "apiaccount",
    "Password": ""
    }
}
- Host == your VBR server IP or hostname
- Port == 9419 is the default, leave it as is unless you have changed during deployment
- APIVersion = 1.0-rev1 is the latest in V12 beta 2, this will change as new versions come out
- APIRouteVersion == is the version in the url path, currently this is just v1 as new versions are released in the future we may see versioning come into play
- Username == service account or account username you want to use to connect to the api
- Password == this can be left empty, in which case it will prompt you in the application, however if you are just playing around in a lab feel free to enter the password, or for production use securely inject/encrypt the appsettings file
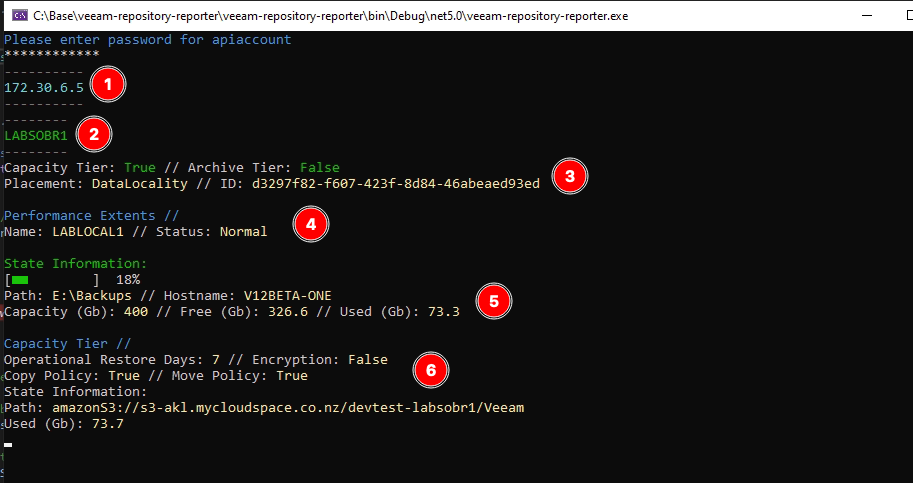
Example output
 Let’s break this down
- The hostname/address of the backup server you have connected too
- The name of the SOBR, note if there is more than one in your environment you will get this header and the info in #3/4/5/6 for each
- Some data and information about the SOBR
- List of performance extents with the name and status of each, under each of these you will get data in #5
- The state information showing a progress bar with capacity usage (will go yellow for >=80%, red for >=90%) and also path, hostname and the raw utilisation numbers
- Capacity tier if enabled will show information about this configuration as well as the utilisation
- Not on the diagram but code below will show the archive tier, similar to #6, I don’t have one of these but I put some code in for this anyway (it should work…)
A note, as this is my lab, the Rest Client is set to ignore SSL warnings because my VBR api is using the self-signed (by default) so you can protect yourself if you need to comment out the **options.RemoteCertificateValidationCallback **line.
Source Code
Download and run as needed.
And it goes without saying… The material embodied in this software is provided to you “as-is” and without warranty of any kind, express, implied or otherwise, including without limitation, any warranty of fitness for a particular purpose.
